Monroe County Emergency Management Updates
The weather in the Florida Keys differs from that of mainland Florida due to their small land mass and the fact that they are completely surrounded by warm waters. Florida Bay and the Gulf of Mexico to the north and west, and the Atlantic Ocean to the south and east. The influence of these waters is to temper summer heat as well as moderate the continental cold fronts approaching from the north during winter months.
Daily variations between high and low temperature are only about 10 degrees F throughout the year. Below you will find historical information about Weather in the Florida Keys. There are also links to NOAA weather stations from Key Largo, Marathon and Key West. You can also see a current Weather Radar Loop for the Florida Keys and check out the NOAA Hurricane Center for more current information.
Key Largo

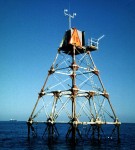
Molasses Reef, FL — C-MAN station — VEEP payload — 25.01 N 80.38 W
Site elevation:0.0 m above mean sea level. Air temp height:15.5 m above site elevation. Anemometer height:15.8 m above site elevation. Barometer elevation:11.3 m above mean sea level.
Marathon

Long Key, FL – C-MAN station = MARS payload – 24.84 N 80.86 W
Site elevation: 0.0 m above mean sea level. Air temp height: 6.7 m above site elevation. Anemometer height: 7.0 m above site elevation. Barometer elevation: 5.8 m above mean sea level.
Key West

Sand Key, FL – C-MAN station – MARS payload – 24.46 N 81.88 W
Site elevation: 0.0 m above mean sea level. Air temp height: 12.8 m above site elevation. Anemometer height: 13.1 m above site elevation. Barometer elevation: 6.1 m above mean sea level.
Historical Weather Data for Key West
| JANUARY | |
| Average High: 74.8°F | Average Low: 65.0°F |
| Record High: 86.0°F | Record Low: 41.0°F |
| Average Precipitation: 2.01 inches | Number of rain days: 6 |
| FEBRUARY | |
| Average High: 75.4°F | Average Low: 65.6°F |
| Record High: 85.0°F | Record Low: 46.0°F |
| Average Precipitation: 1.80 inches | Number of rain days: 6 |
| MARCH | |
| Average High: 78.6°F | Average Low: 69.0°F |
| Record High: 87.0°F | Record Low: 47.0°F |
| Average Precipitation: 1.71 inches | Number of rain days: 5 |
| APRIL | |
| Average High: 81.7°F | Average Low: 72.2°F |
| Record High: 90.0°F | Record Low: 48.0°F |
| Average Precipitation: 1.75 inches | Number of rain days: 5 |
| MAY | |
| Average High: 85.1°F | Average Low: 76.1°F |
| Record High: 91.0°F | Record Low: 64.0°F |
| Average Precipitation: 3.46 inches | Number of rain days: 8 |
| JUNE | |
| Average High: 87.6°F | Average Low: 78.5°F |
| Record High: 94.0°F | Record Low: 68.0°F |
| Average Precipitation: 5.09 inches | Number of rain days: 11 |
| JULY | |
| Average High: 89.1°F | Average Low: 79.6°F |
| Record High: 95.0°F | Record Low: 69.0°F |
| Average Precipitation: 3.61 inches | Number of rain days: 12 |
| AUGUST | |
| Average High: 89.2°F | Average Low: 79.3°F |
| Record High: 95.0°F | Record Low: 68.0°F |
| Average Precipitation: 5.03 inches | Number of rain days: 14 |
| SEPTEMBER | |
| Average High: 88.0°F | Average Low: 78.5°F |
| Record High: 94.0°F | Record Low: 69.0°F |
| Average Precipitation: | Number of rain days: 16 |
| OCTOBER | |
| Average High: 84.4°F | Average Low: 75.5°F |
| Record High: 93.0°F | Record Low: 60.0°F |
| Average Precipitation: 4.42 inches | Number of rain days: 11 |
| NOVEMBER | |
| Average High: 80.0°F | Average Low: 71.2°F |
| Record High: 89.0°F | Record Low: 49.0°F |
| Average Precipitation: 2.84 inches | Number of rain days: 7 |
| DECEMBER | |
| Average High: 76.1°F | Average Low: 66.8°F |
| Record High: 86.0°F | Record Low: 44.0°F |
| Average Precipitation: 2.02 inches | Number of rain days: 7 |
